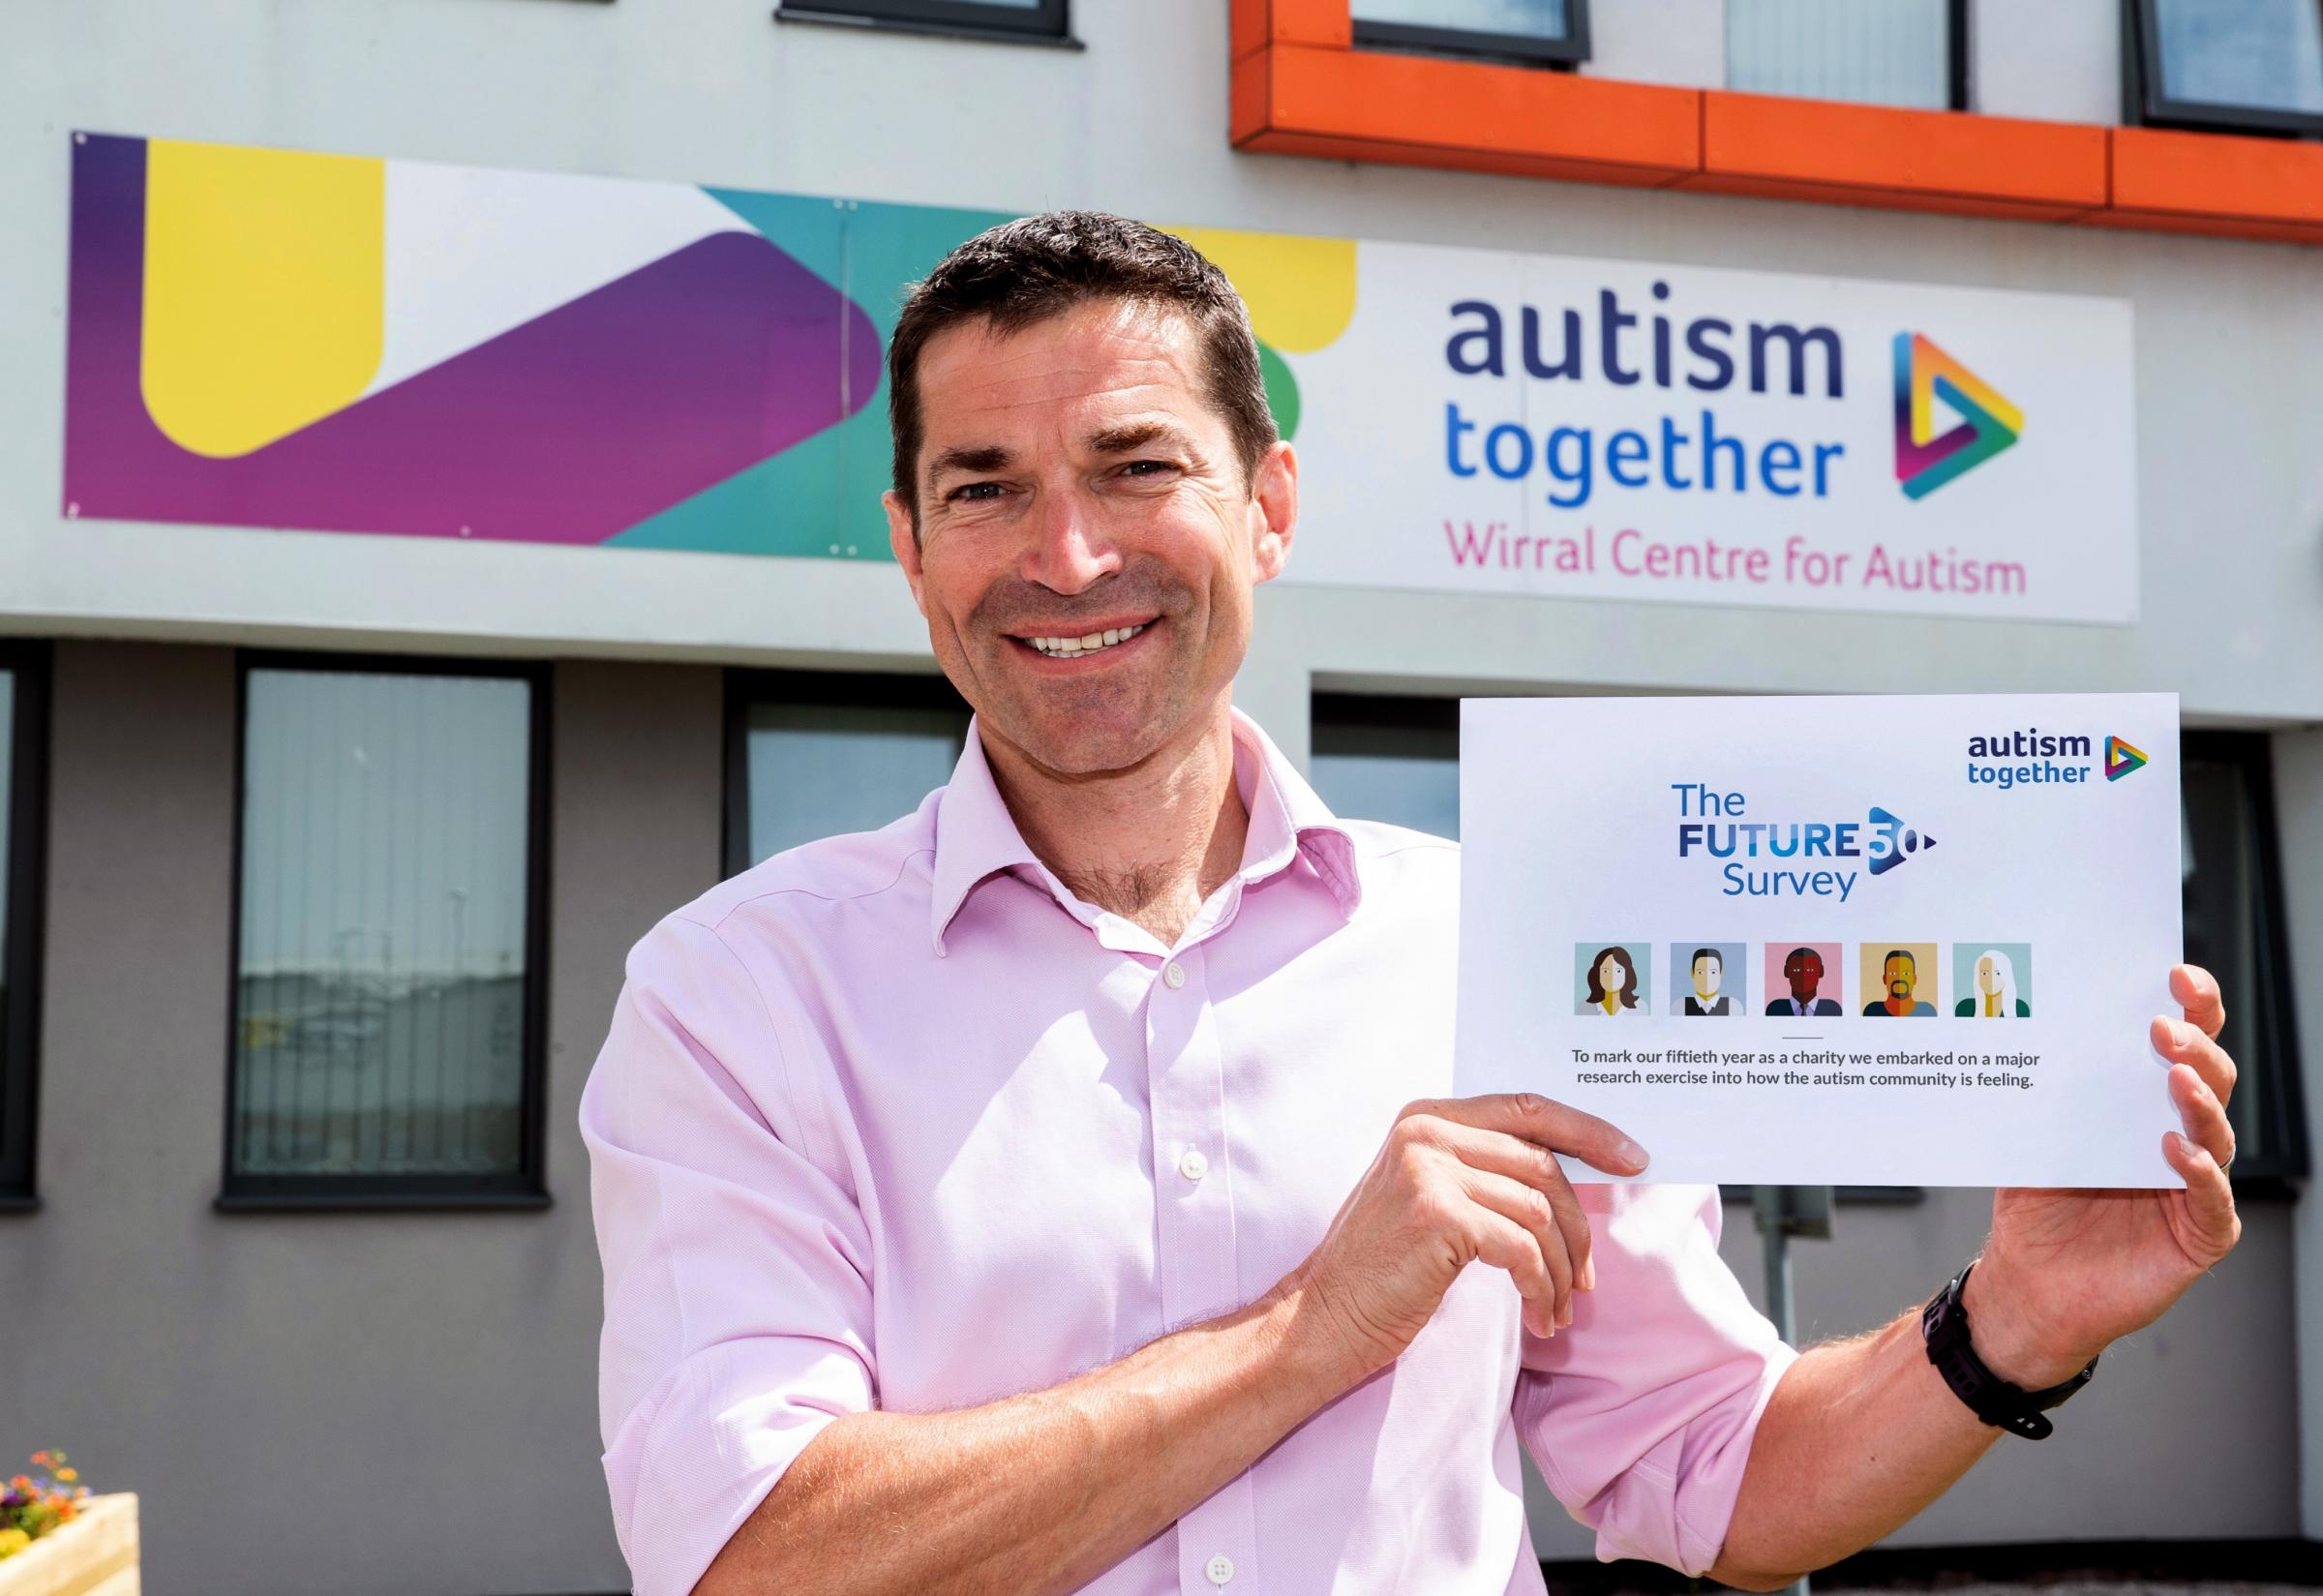
In 1968 a group of parents established The Wirral Society for Autistic Children, which was the forerunner for our organization today. Autism Together has grown from providing support to people with autism, to providing a wide range of living options, day services and community support to people all over the UK. Autism Together campaigns on behalf of all individuals affected by autism, they encourage all supporters to get involved with fundraising and volunteering. They offer comprehensive training and job development for all their employees.
The Challenge
Autism Together hired us along with another researcher abroad to develop a system which would track and comprehend all the data they record while monitoring individuals with autism. We had to investigate all the data they capture, video feeds, and data collected by third party applications.
We were tasked to develop a tool where all of this data can be presented together in a comprehensible manner and intuitive user interface. This is why the second challenge was designing a tool which would display all this data in a simple and effective manner, where user could easily navigate around the data to discern significant from insignificant or invalid data.
Personnel could then observe and obtain statistics from this data, as well as draw some higher level conclusions supported by this data. Challenge here was to make sure selecting a time slice of data would synchronize between all the recorded data and filter it to that selected time range.
The Cape Ann Solution
We have built a complete application using Angular on frontend and Python on backend side. We developed a full API to handle file upload (video and various data spreadsheets), and also integrated S3 into the app so that files can be downloaded directly from S3 bucket. We gave the client ability to create presentations of data, where they can select which data they want to display on the presentation from all available data. A post-processing filter was added to the tool to validate and differentiate between usable and non-usable data. Video data was displayed in a video player while sensory data was shown on a chart next to the video. Chart was linked to the video so that selecting a point on chart would forward video to that same point in time.

Schwozny is a company which provides services for data analytics and management to pharmaceutical companies which outsource experimentation to other contract research organizations. Schwozny clients have access to a powerful one-stop, data repository that will increase information content to provide decision making data and ensure timely visibility with potential industry partners.

The Challenge
Analyzing complex data from any pharmaceutical or biology research related business often means you will have to deal with many different picture formats.

Images would have to be modified and enhanced within the tool, so another challenge was developing and implementing such capabilities.

We were given the difficult task of building a tool which would open and display image of any format and size, setting it up for modification and further analysis.
The Cape Ann Solution
Following a period of extensive research during which we focused on the challenge of loading and displaying very large resolution pictures in an quick and effective manner, we came up with a solution which transformed them into a set of lower resolution images with considerably lower size. When user opened any image, an appropriate image from the set was displayed using image tiling techniques based on the zoom he was currently using. This approach was very fast, and images would load seamlessly. Our team then developed a framework within the tool which enabled image enhancement and modification tailored to the users needs. We used breakthrough technologies in cloud storage, computing, and software deployment to deliver the final product. Considering the short time period given for development, agility was a core requirement for our team, and in the end, final product was very well received as it was easy to deploy, very fast, and met the specified requirements.
NuVasive strives to develop novel surface and structural technologies to enhance the osseointegration and biomechanical properties of surgical materials. They develop proprietary design and manufacturing methods behind Advanced Materials Science that create implants intelligently designed for fusion. As the leader in spine technology innovation, they maintain focus on transforming spine surgery to deliver clinically-proven surgical outcomes. LessRay powered by Surgical Intelligence, is an image enhancement platform designed to take low-quality, low-dose images and improve them to look like conventional full-dose images. X-ray or fluoroscopic radiation has been identified as a potential cause for a host of medical problems. LessRay offers the physician and hospital system the opportunity to use significantly reduced radiation imaging in the O.R.
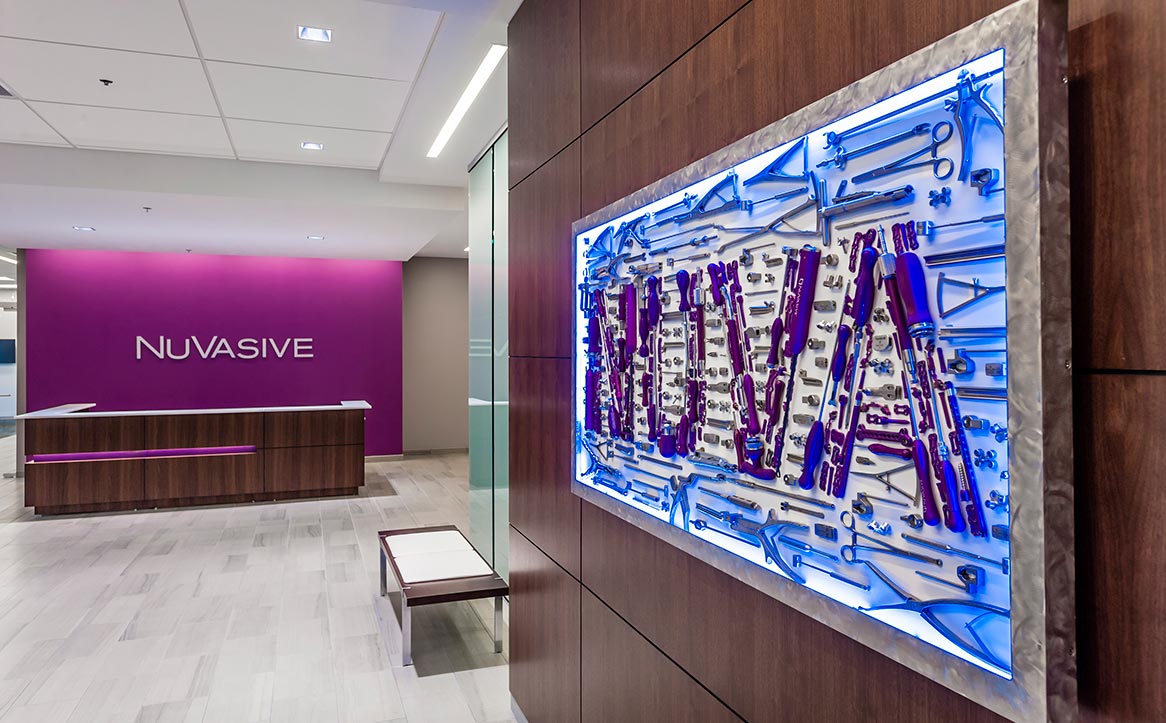
The Challenge
Nuvasive wanted us to collaborate with them on a proof of concept project which would completely change the way their LessRay platform operates. Our first challenge was to quickly grasp the way their current system operates, and the logic behind LessRay X-ray imaging.
Instead of just enhancing low-dose images that x-ray device records, it would have an embedded neural network which would isolate specific areas on the low-dose image. Challenge was to grasp how the neural network works and how it ties together with Mask R-CNN framework, and to validate and assess the quality of Mask R-CNN resulting images.
Final challenge was to design an algorithm would then locate the same areas on a full-dose image and replace low-quality, grainy areas with appropriate high resolution areas from full-dose image using geometric transformations.
The Cape Ann Solution
Tensorflow was used to manipulate the neural network which has a state of the art Mask R-CNN framework for object segmentation built on top of it. This neural network (NN) was trained using a vast amount of images Nuvasive provided for NN calibration, and then used on fresh images to test how well the recognition algorithm works in practice. After Mask R-CNN locates and marks the areas of interest (zones) on low-dose image, these same zones would be located on the full-dose image and replaced accordingly. Due to complex and sensitive nature of project, only scalar transformations are allowed on the image. We successfully set up the network and Mask R-CNN framework running in the environment and used Python for zone extraction. Big emphasis was placed on speed of development because this was only a prototype project. This is why Python and all the sci libraries like Tensorflow, scipy, opencv, keras, and others available in it were put in use.

Unilever is a British-Dutch transnational consumer goods company co-headquartered in London, United Kingdom and Rotterdam, Netherlands. Its products include food and beverages (about 40 percent of its revenue), cleaning agents and personal care products. It is the world's largest consumer goods company measured by 2012 revenue.It is Europe’s seventh most valuable company. Unilever is one of the oldest multinational companies; its products are available in around 190 countries.
The Challenge

With increasing number of projects Unilever was working on, it was becoming increasingly difficult to manage them. Consolidating available data and getting project status update to the client was becoming a problem. We stepped in to develop a tool to help them deal with these issues.
Processes which these projects generate, governed by internal business logic are the key business aspect Unilever wanted to have a grasp on at any time. Our second challenge was to understand and incorporate their internal business logic into the application we were developing.

One of the main purposes of this app would be to help stakeholders have a clear overview of what stage their projects are in at any given time. This is why we had to heavily research ways to visualize project flow and key project assets and metrics in an intuitive and simple manner to ensure key information was understood by the stakeholders.
The Cape Ann Solution
While client was still figuring out the nuisances of their large business data model, we were brought in to design a custom project management tool on top of that model. We partitioned the data model into separate segments and went on to develop those. We took an agile approach developing these features, and finished them in record time, only a couple of weeks after kickoff meeting. Even though data model was complex, we minimized the number of sections and pages the web tool had, and by grouping various information on one page in a smart manner and reducing the number of different forms for data input we have minimized the amount of clicks user needs to get to where they want to be. App was deployed to client for testing and Unilever was very satisfied with the results.
What Unilever said...
High quality... delivery exceedsHigh value... great value for the money
Fast turnaround... working in multiple time zones makes turn around time faster... the team is a pleasure to work with.

What Schwozny Analytics said...
Aspects that I have been most impressed with Cape Ann is their dedication to the project, resourcefulness and production of very high quality work. The diligent efforts by Cape Ann have manifest in the production of stellar work product... The work the Cape Ann have performed is exceptional, well-founded mixture of functionality, performance and style.